My intro
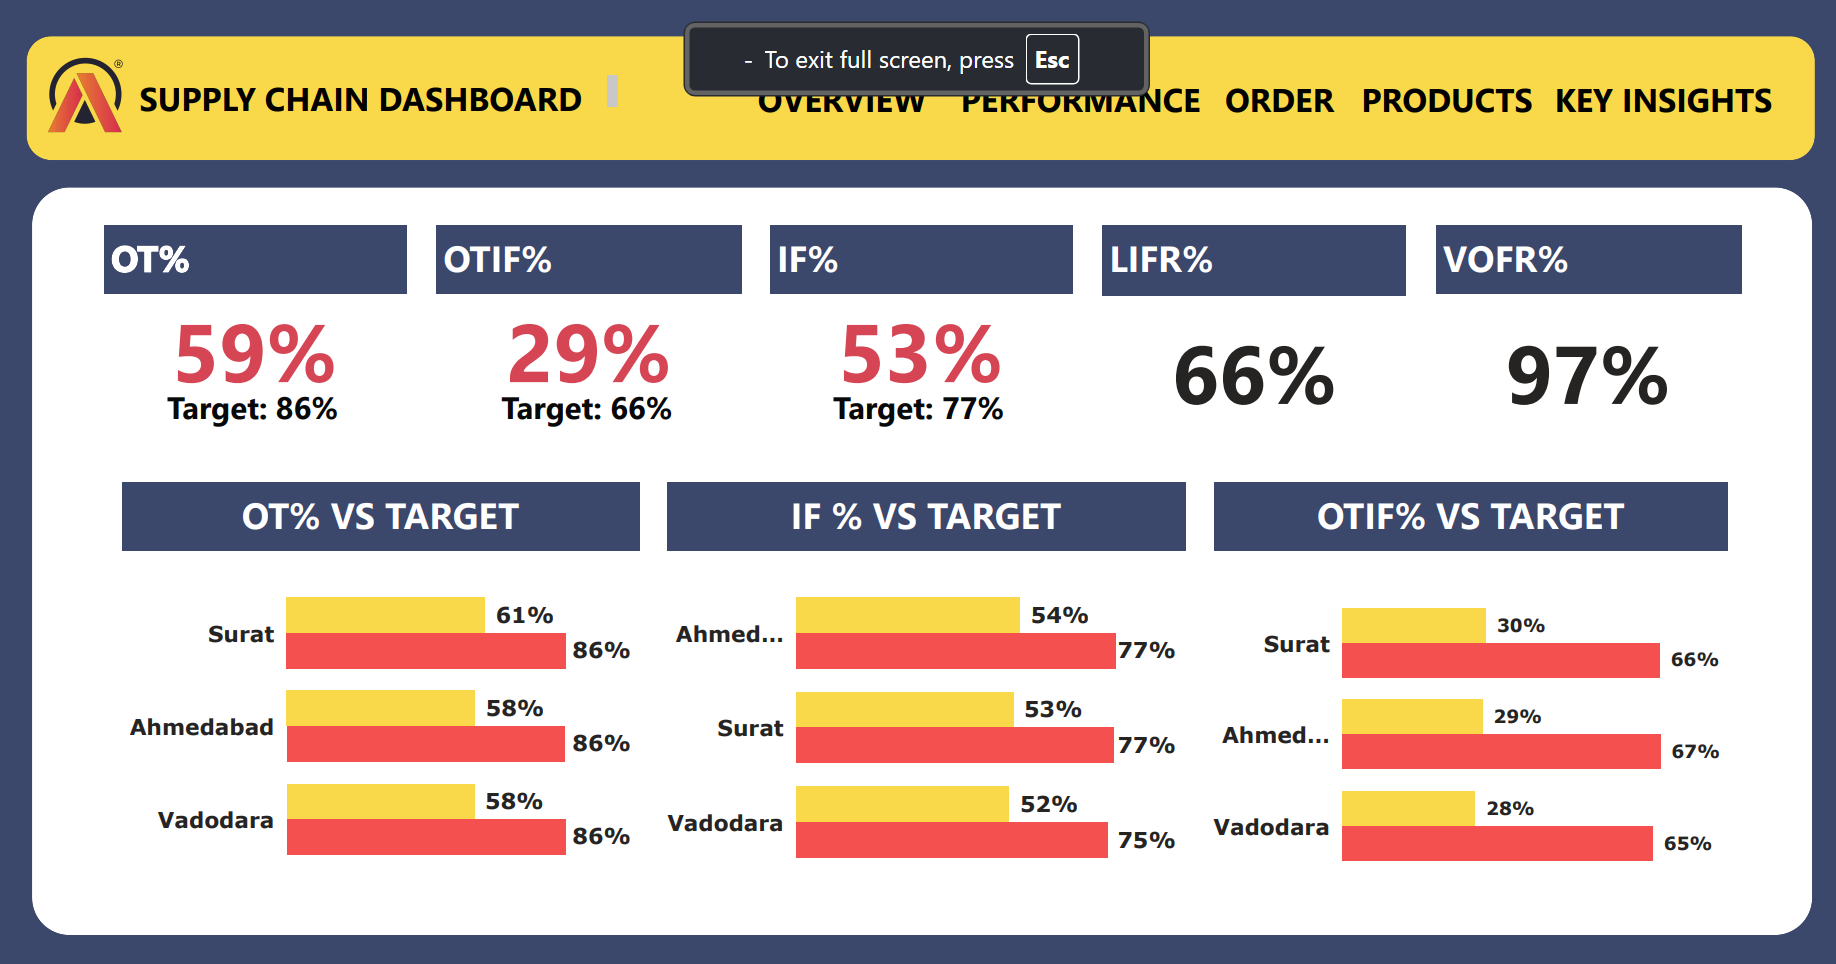
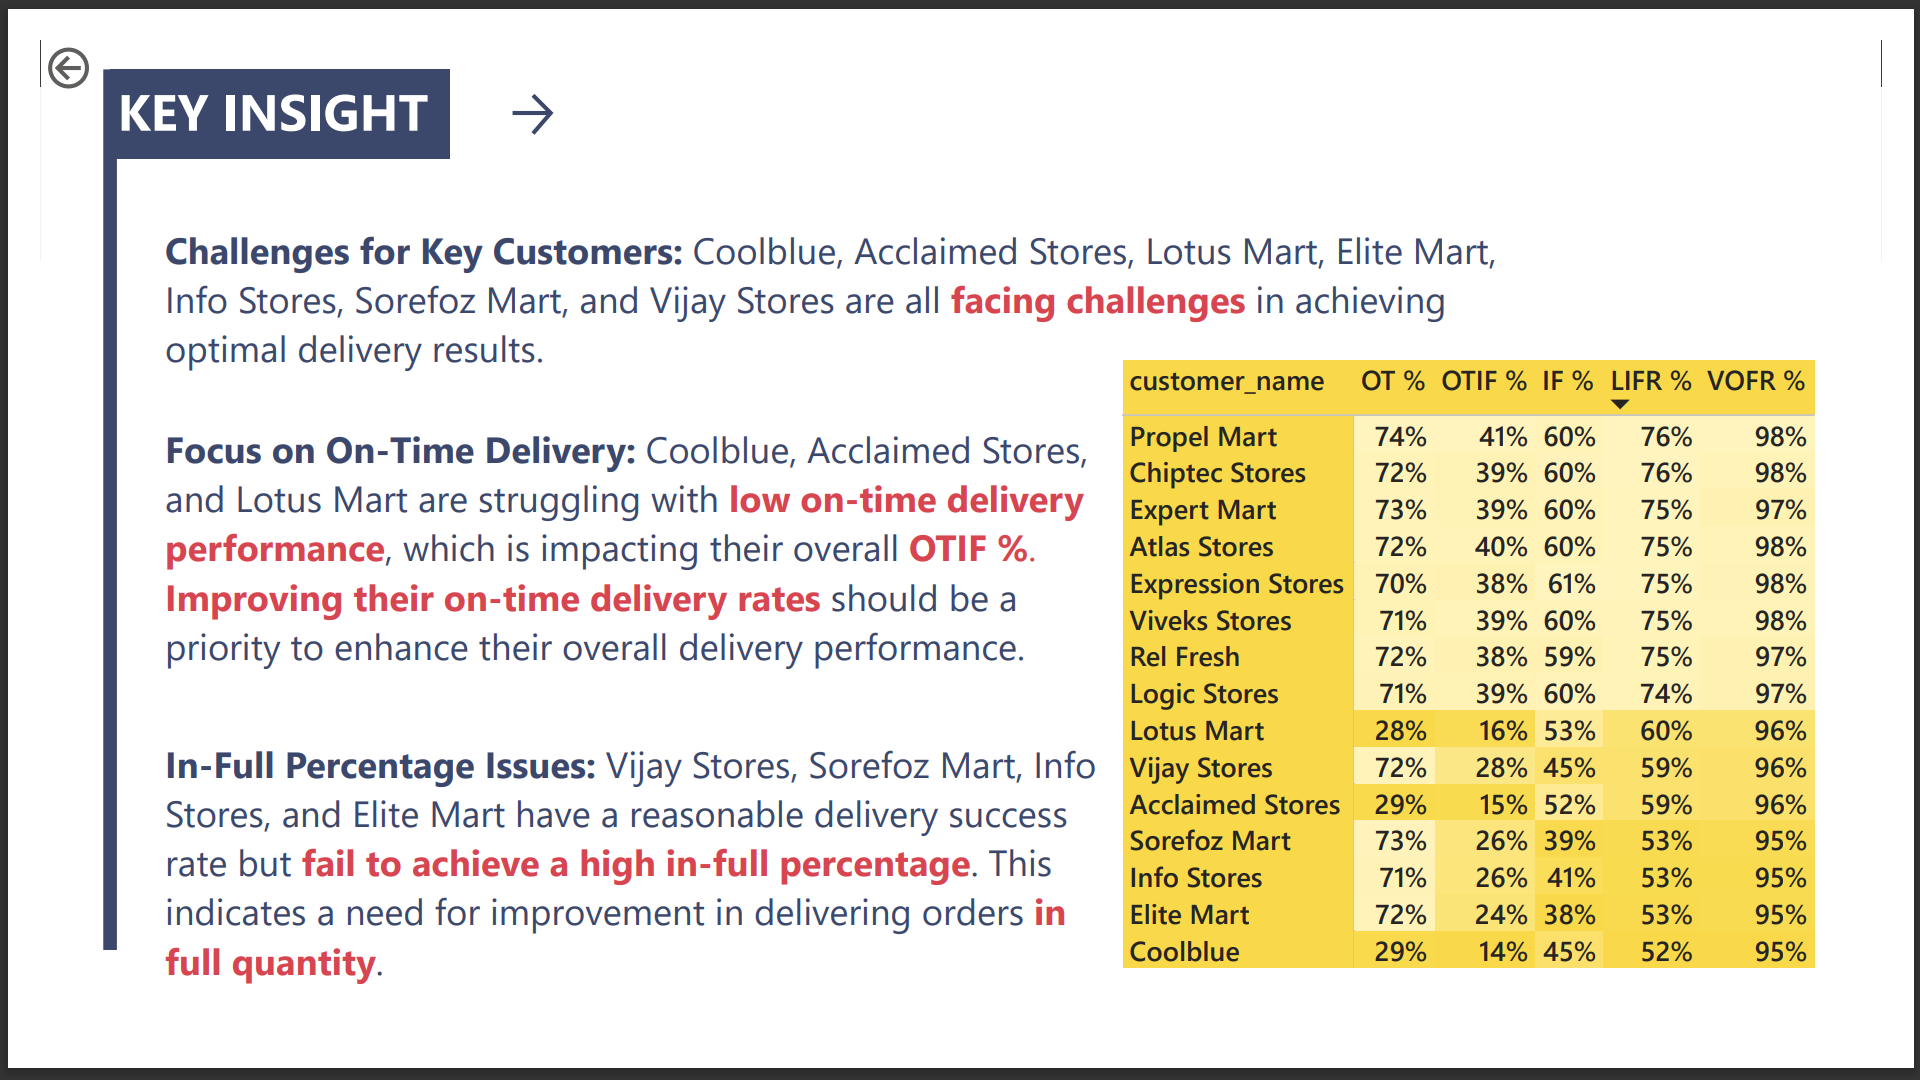
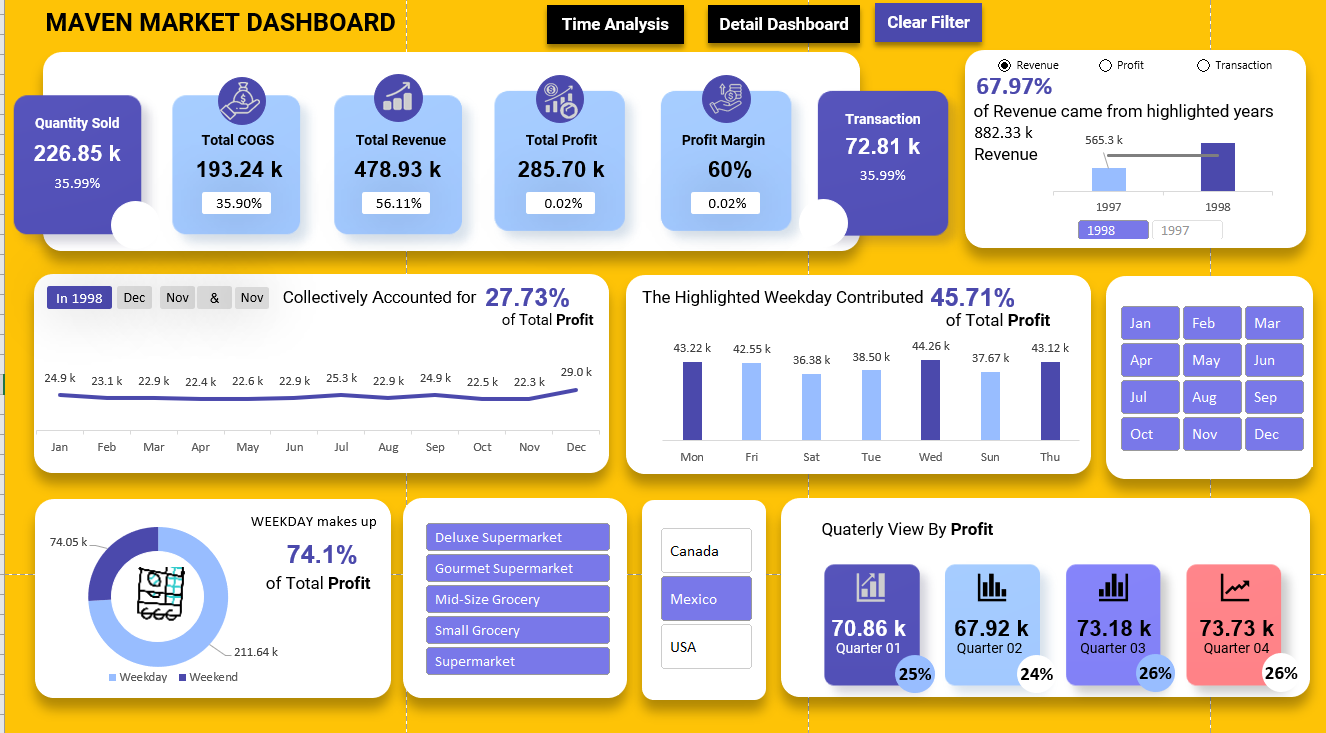
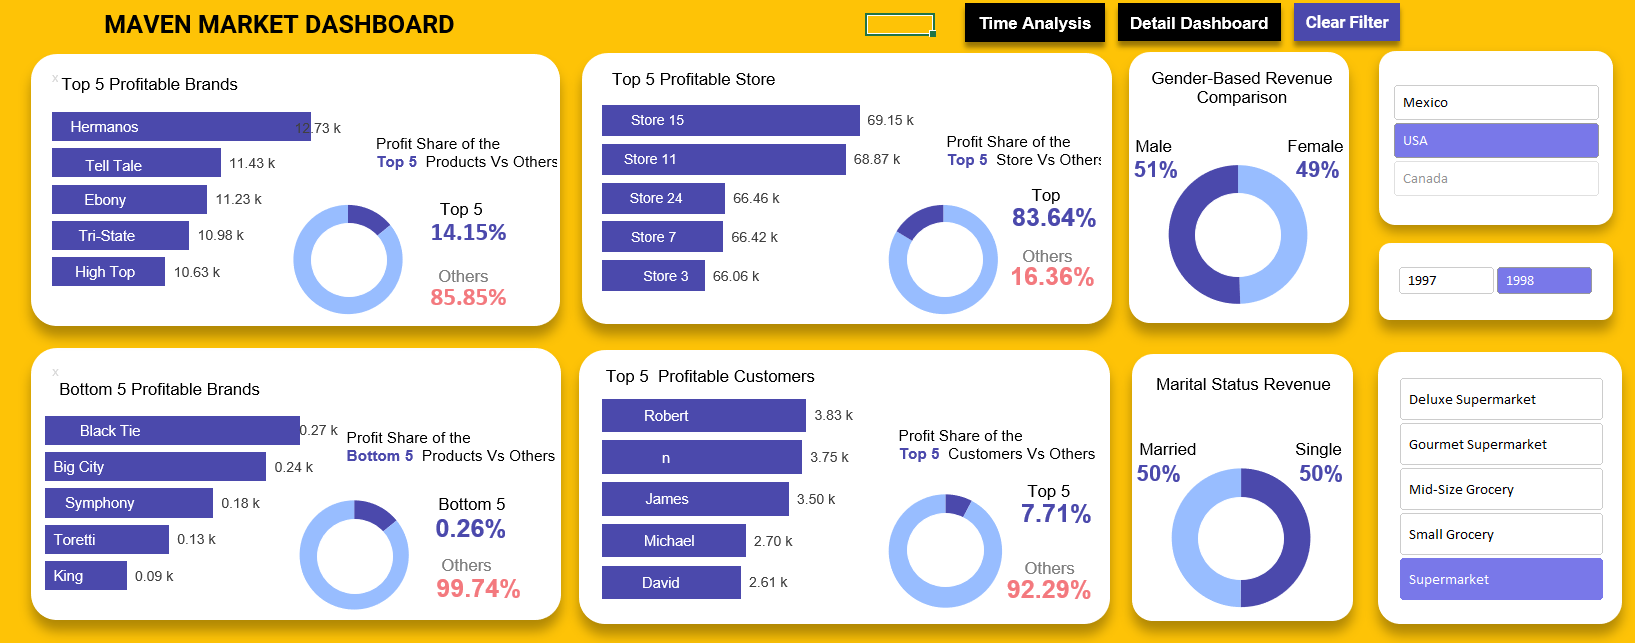
An data analyst with practical experience in SQL, Excel, Power BI, and Python. Currently, I’m working at Oracle (via HRSG) as an Advanced Support Engineer, mainly handling Oracle Identity Manager. I also got the opportunity to build real-time dashboards using Oracle BI Publisher and automate Excel-based health reports that support data-driven decision-making. Outside of work, I’ve completed self-learning projects including a supply chain dashboard in Power BI, sales analysis in SQL, and real estate price prediction using Python. I enjoy cleaning messy data, finding patterns, and creating clear, insightful visual stories. I'm passionate about solving real problems through
data and always excited to learn, grow, and contribute more through my work.
Contact Me
My portfolio
All
Power BI
SQL
Excel
Python
Business Challenge:
AtliQ Mart, a fast-growing FMCG retailer, faced frequent stockouts and delayed deliveries due to supply chain inefficiencies across multiple regions.
Approach:
Using Power BI, I monitored daily performance KPIs like OT%, IF%, and OTIF% for all City. A detailed breakdown by region, product category, and customer helped identify the root causes of service gaps.
Key Insights & Impact:
Six key customers contribute over 53% of total orders—indicating priority focus for service and strategy.
Dairy category dominates with 79.3% of total orders—highlighting it as a critical product and inventory area.
OT%, IF%, and OTIF% are below targets—indicating delivery inefficiencies affecting customer satisfaction and loyalty.
Line Fill Rate is low for major customers—signaling inefficiencies in fulfilling complete order lines.
Suggested inventory optimization and tech integration to improve fulfillment accuracy and delivery consistency.
Business Challenge:
To support Maven Market’s growth in the U.S., I conducted an in-depth sales performance analysis after noticing uneven profit trends in 1998. Despite a major revenue increase, profitability wasn’t consistent across all store types and products.
Approach:
Using Excel, I cleaned and structured raw sales data, built a relational model, and developed a dynamic dashboard with calculated metrics for revenue, profit, and transactions. The analysis emphasized seasonal patterns, store-level performance, and product-specific trends.
Key Insights & Impact:
• Revenue grew 56% YoY, but profit remained flat, signaling inefficiencies in store and product-level performance.
•Supermarkets led in revenue and profit, with higher average transaction value—ideal for premium pricing and bulk promotions
•Transactions increased 36%, revealing strong customer activity but low margin contribution from some product categories.
•Q4 showed the highest revenue, highlighting a seasonal opportunity for targeted marketing and inventory planning.
Business Challenge:
The objective was to develop a weekly credit card financial dashboard that offers real-time insights into customer behavior, revenue patterns, and transactional trends—helping stakeholders monitor and optimize credit card operations effectively.
Approach:
Using Power BI & SQL, I created calculated columns and custom DAX measures to segment customers by age, income, and weekly performance. The model included dynamic metrics like current vs. previous week revenue, card category contribution, and satisfaction scores. I built two interactive dashboards—one focused on transactions and the other on customer behavior.
Key Insights & Impact:
• Generated a total revenue of $55M YTD, with interest earnings of $7.84M and transaction volume of 656K+
• Week 52 snapshot: $933K in revenue, 11K+ transactions, and an improved customer satisfaction score of 4.21
• Identified that male customers contributed 30M vs. 25M from females, with the 40–50 age group as top spenders
Business Challenge:
Built a house price prediction model using regression techniques on Kaggle’s housing dataset. Focused on clean data prep, smart feature engineering, and model optimization.
Approach:
The project followed a 3-phase pipeline: Data Analysis, Feature Engineering, and Feature Selection.
Handled missing values, transformed skewed data, and encoded categorical variables.
Selected key features using Lasso regression to boost model performance.
Key Insights & Impact:
• Identified key predictors such as Overall Quality, Living Area, and Garage Area that strongly influence house price predictions.
• Reduced model complexity by selecting 30+ impactful features using Lasso regression, improving performance and reducing overfitting risk.
• Filled over 15% missing data using tailored imputation strategies, ensuring data integrity and enhancing model training quality.
• Boosted model accuracy and interpretability by engineering meaningful features and removing noisy or less relevant variables.
Designed dashboards and visual reports to present insights and improve strategy.
Worked with SQL to query and manipulate databases, join tables, and extract valuable insights.
Analyzed data, created pivot tables, and generated reports for better decision-making.
Used Python for data cleaning, transformation, and analysis with Pandas and Matplotlib.
Fixed missing data, handled outliers, and prepared clean datasets for analysis.
Explained data insights clearly to both technical and non-technical teams.
Get in Touch